
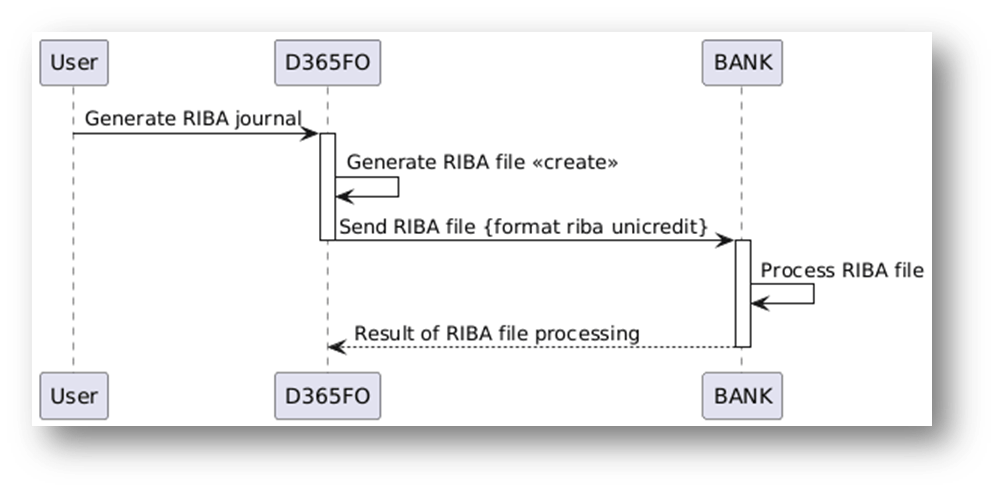
Sequence diagrams are used to analyze the communication sequence between solution components. They allow us to observe when components interact, how they communicate, and under what conditions these interactions occur.
Let’s look at an example. In D365FO, a user generates a RIBA payment file to send to the bank. After processing, the bank returns a response file containing the result of the collection/payment (accepted or protested):
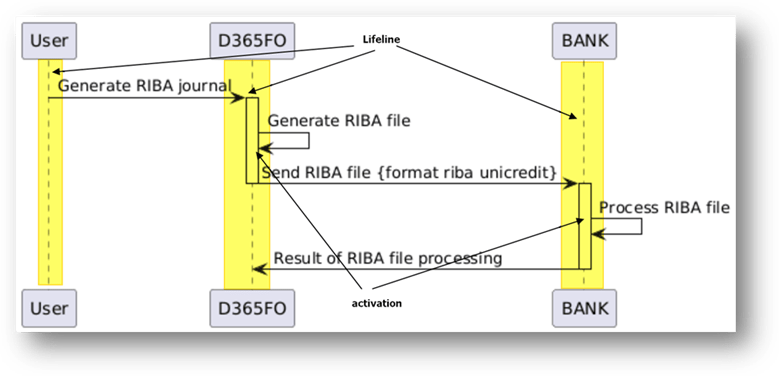
The lifeline represents a specific solution component, that is the focus of our observation in the sequence diagram. It shows the existence and lifetime of that component over the duration of the interaction.
During the process, we observe when the component is active:
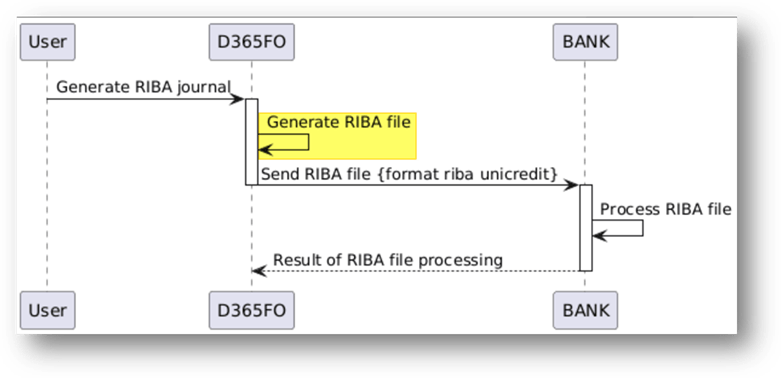
We can see the self message (the element invoked itself):
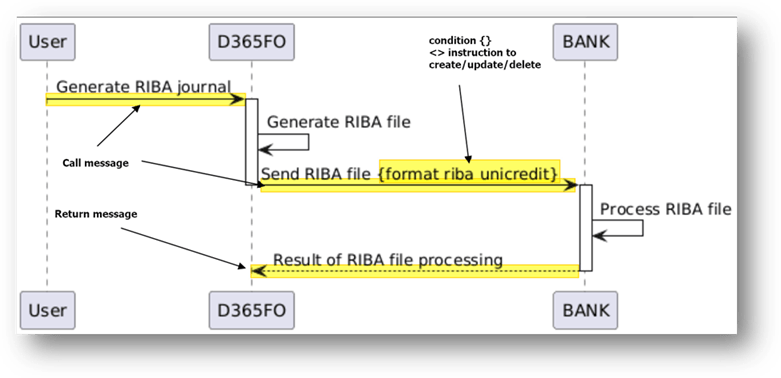
The diagram enables to show the call, return message and the condition or instruction:
PlantUml code
For reference, here is the PlantUML code used to generate the diagram (note: this is the same from the code used for the component diagram).
@startumlUser -> D365FO: Generate RIBA journalactivate D365FOD365FO -> D365FO: Generate RIBA file <<create>>D365FO -> BANK: Send RIBA file {format riba unicredit}deactivate D365FOactivate BANKBANK -> BANK: Process RIBA fileBANK --> D365FO: Result of RIBA file processingdeactivate BANK@enduml

Leave a comment